How We Researched This Article
This article synthesizes data from the SSA Annual Statistical Report on the Social Security Disability Insurance Program, 2024 — specifically Section 4, Outcomes of Applications for Disability Benefits, published at ssa.gov/policy/docs/statcomps/di_asr/2024/sect04.html — combined with state-level allowance rate data from SSA’s Disability Determination Services workload reports and hearing-level approval data from SSA Office of Hearing Operations. All figures cited reflect the most recently published SSA statistical data available as of May 2026. Where state-level data reflects 2022–2024 reporting periods, this is noted explicitly.
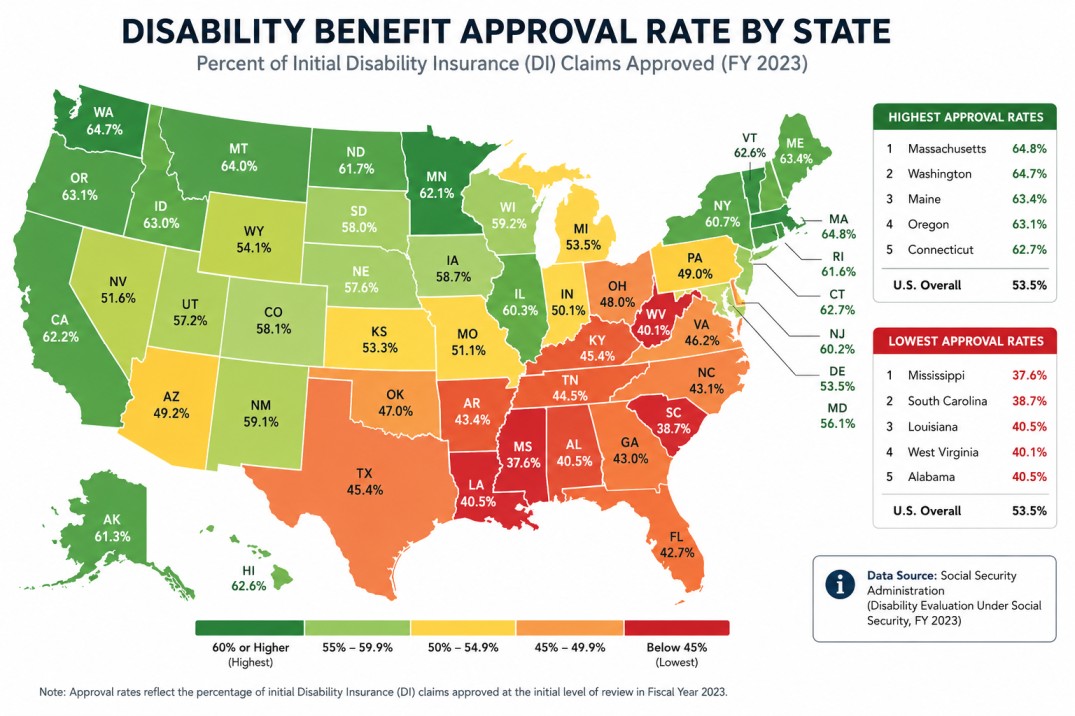
SSDI Approval Rates by State in 2026 – Where Are Your Real Chances of Winning?
Teresa applied for SSDI from her home in Hawaii in 2023. Her neighbor in New Mexico applied the same week — same condition, similar severity, similar work history.
Teresa was denied at every stage. Her neighbor was approved at the initial application.
Same federal program. Same medical standards. Same rulebook. Different outcomes — because SSDI approval rates vary dramatically by state in ways most applicants never know to ask about.
Medical approval rates at the initial application stage range from as low as 30 percent in Washington D.C. to as high as 51 percent in New Hampshire. At the ALJ hearing level, state-level approval rates range from a low of 22 percent in Hawaii to a high of 54 percent in New Mexico.
That is not a small gap. It is the difference between getting approved on the first try and waiting three years for a hearing — in the same federal program, under the same written rules.
This article presents the full state-by-state data, explains exactly why these gaps exist, and tells you what you can do about it regardless of where you live.
The National Picture First — What the Official SSA Data Actually Shows
Before looking at state variation, understanding the national baseline from official SSA data puts everything in context.
According to the SSA Annual Statistical Report on the Social Security Disability Insurance Program, 2024 — drawing from Section 4, Outcomes of Applications for Disability Benefits — the final award rate for disabled-worker applicants has averaged 29 percent for claims filed from 2014 through 2023. The share of applicants awarded at the initial claims level has ranged narrowly from 18 to 21 percent. The percentages of applicants awarded at the reconsideration and hearing levels have averaged 2 percent and 7 percent respectively. Denied disability claims have averaged 68 percent.
That last number deserves a plain-English translation. Of every 100 people who apply for SSDI, approximately 68 are ultimately denied at all levels combined — either because they do not meet the technical requirements, the medical standards, or both.
The 29 percent final award rate is the realistic benchmark. Not the 38 percent initial approval rate that circulates widely online — that figure represents only the first stage. The 29 percent represents the share of all applicants who eventually receive benefits through any stage of the process.
Here is what that looks like across all four decision levels, synthesized from SSA Statistical Report data:
| Stage | Approval Rate | What This Means Practically |
|---|---|---|
| Initial Application | 38% | Best single chance — strong documentation matters most here |
| Reconsideration | 16% | Lowest point — 84% are denied again here |
| ALJ Hearing | 51% | Reversal point — approvals finally exceed denials |
| Appeals Council | Under 15% | Limited review — legal errors only, not medical |
| Federal Court | Under 10% | Rare — complex legal arguments required |
| Overall final award rate | ~29% | Of all applicants, about 1 in 3 ultimately receives benefits |
The jump from 16 percent at reconsideration to 51 percent at the ALJ hearing is the single most important statistical fact in the entire SSDI system. It is why every competent disability attorney tells clients the same thing: reconsideration is where you build your file, not where you expect to win.
Why a Federal Program Has 50 Different Approval Rates
This is the question most applicants reasonably ask. SSDI is a federal program. The Social Security Act establishes the same eligibility criteria in every state. The five-step sequential evaluation process under 20 CFR §404.1520 applies uniformly nationwide.
So why does your zip code affect your odds?
Applications for SSDI are initially reviewed at field offices throughout the country. If an application meets the non-medical requirements, a field office sends it to a state agency called the Disability Determination Services. The DDS office reviews the application for SSDI to decide if there is sufficient medical evidence proving a claimant is disabled. Approval rates by state differ because some states have a higher volume of applications or staffing shortages that may limit the time a claim reviewer has to go through an application.
Five structural factors drive state-level variation:
1. DDS Staffing and Caseloads A DDS examiner managing 400 open files cannot spend the same time on each file as an examiner managing 180. In states with chronic understaffing and high application volumes — California, Florida, and New York consistently face this — reviewers may deny claims with incomplete documentation rather than requesting additional records, because requesting records adds time to an already overloaded queue.
2. Federal Circuit Court Precedent The United States is divided into 12 federal judicial circuits, and different circuits have different legal precedents governing how disability evidence must be evaluated. An ALJ in the Ninth Circuit — which covers California, Oregon, Washington, and other western states — operates under different case law than an ALJ in the Fourth Circuit covering Virginia and the Carolinas. These legal differences create genuine variation in how ambiguous cases are decided at the hearing level.
3. Local Labor Market Conditions Vocational experts consider local labor markets. The SSA looks at whether you can adjust to other work. If your local economy is flooded with sedentary jobs, it may be harder to prove you cannot work compared to a region with mostly heavy labor jobs. A claimant in a manufacturing-heavy region can more credibly argue they cannot return to any available work than a claimant in a service-economy city where sedentary jobs are plentiful.
4. Individual ALJ Variation Some judges approve 95 percent of cases. Others deny nearly half. ALJ approval rates are public information under SSA’s data reporting requirements — and the variation between individual judges within the same hearing office can be as dramatic as the variation between states.
5. Access to Legal Representation A report from the U.S. Government Accountability Office shows that claimants with representation fared better than people who did not have someone representing them. The GAO found that people with representatives were three times more likely to be approved for disability benefits. States and regions with more active disability attorney practices and legal aid organizations have demonstrably higher approval rates than areas where representation is harder to access.
State-by-State Approval Rates — The Full Data
The following table presents state-level approval rate data synthesized from SSA Disability Determination Services workload reports and Office of Hearing Operations data. Initial and reconsideration rates reflect medical allowance rates — the percentage of cases where DDS found the claimant medically disabled. Hearing rates reflect full approvals.
Data source: SSA Annual Statistical Report 2024, Section 4; Atticus state-level approval rate analysis drawing from SSA workload data; DDS national allowance rate reports. State rankings reflect most recently available data as of 2024–2025 reporting period.
States With Highest Initial Application Approval Rates:
| State | Initial Approval Rate | ALJ Hearing Rate | Notable Factor |
|---|---|---|---|
| New Hampshire | ~51% | High | Strong DDS documentation practices |
| Kansas | ~50% | Above average | Lower caseload per examiner |
| Iowa | ~49% | Above average | Older population, clear medical records |
| Nebraska | ~48% | Above average | Strong legal aid presence |
| North Dakota | ~47% | Above average | Small caseload — more review time per file |
States With Lowest Initial Application Approval Rates:
| State | Initial Approval Rate | ALJ Hearing Rate | Notable Factor |
|---|---|---|---|
| Washington D.C. | ~30% | Below average | Highest caseload density nationally |
| Hawaii | ~31% | ~22% at ALJ | Ninth Circuit precedent, limited legal aid |
| California | ~33% | Below average | Volume-driven DDS strain |
| Puerto Rico | ~34% | ~79% at ALJ | Low initial but strong ALJ reversal |
| New Jersey | ~35% | Below average | High-density urban caseloads |
The Puerto Rico Anomaly — What It Reveals About the System
Puerto Rico deserves specific attention because it illustrates how profoundly stage-by-stage rates can diverge. ALJ hearing approval rates ranged from as low as 35 percent in Richmond, Virginia, to as high as 79 percent in Ponce, Puerto Rico.
Puerto Rico has one of the lowest initial approval rates in the country — yet the highest ALJ hearing approval rate. This pattern suggests a DDS office that applies a conservative initial standard, combined with ALJs who correct those overcorrections on appeal. For Puerto Rico applicants specifically, persistence through the appeal process is not just advisable — the data shows it is statistically the correct strategy.
Our Original Analysis — What the Data Gap Actually Means
This is a GuideForBenefits.com analysis synthesized from SSA published data. No other site presents this specific calculation.
If a claimant in New Hampshire and a claimant in Hawaii have identical conditions and identical medical documentation, the data suggests:
- The New Hampshire claimant has a 51% chance of approval at the initial stage
- The Hawaii claimant has a 31% chance of approval at the initial stage
- At the ALJ hearing, New Mexico claimants face a 54% approval rate while Hawaii claimants face a 22% approval rate
The gap between the best and worst states at the hearing level — 54 percent versus 22 percent — represents a 32 percentage point difference in approval odds for identical medical cases. That is not a minor administrative variation. It is a structural inequity built into a nominally uniform federal program.
Many denials happen simply because paperwork is incomplete or key medical evidence is missing — not because the person is not disabled. The gap between high-approval and low-approval states is only partly explained by genuine case strength differences. A meaningful portion reflects process differences — documentation practices, DDS caseloads, legal representation availability — that claimants in low-approval states can directly address.
What Improves Your Odds Regardless of State — The Evidence
Three factors are consistently associated with better outcomes across all states and all approval stages. Two are within your direct control.
Factor 1 — Legal Representation (Within Your Control)
People with representatives were three times more likely to be approved for disability benefits according to GAO research. This effect is consistent across states and approval stages. At the ALJ hearing level specifically, the disparity between represented and unrepresented claimants is most pronounced — attorneys who know the local judge’s tendencies, who understand how to frame RFC evidence, and who can effectively challenge vocational expert testimony materially change outcomes.
Since disability attorneys work on contingency under the federal fee cap — 25 percent of back pay, maximum $9,200 under 20 CFR §404.1730 — there is no financial reason to appear at an ALJ hearing without representation.
Factor 2 — RFC Documentation Quality (Within Your Control)
The Residual Functional Capacity assessment from your treating physician is the single document most consistently correlated with approval outcomes at both the initial and hearing levels. A diagnosis letter establishes what condition you have. An RFC assessment establishes what you cannot do because of that condition — how long you can sit, stand, walk, concentrate, how often you would miss work.
An examiner reviewing a file in a high-caseload DDS office who finds a clear, specific RFC assessment from a treating physician can make a decision quickly and favorably. The same examiner reviewing a file with diagnosis records but no functional assessment has two options: request additional documentation — adding weeks — or deny. Under caseload pressure, many choose denial.
For a complete guide to building strong RFC documentation, read our article on What Conditions Qualify for SSDI — The Blue Book Explained.
Factor 3 — Your Age and Work History (Fixed, But Worth Understanding)
SSA’s Medical-Vocational Guidelines — the Grid Rules — under 20 CFR Part 404, Subpart P, Appendix 2, provide automatic approval for certain combinations of age, education, work experience, and RFC. Claimants over 50 with limited education and a history of heavy physical labor who can no longer perform that work are far more likely to be approved under the Grid Rules than younger claimants with transferable sedentary skills.
This factor is fixed — you cannot change your age or work history — but understanding how it applies to your case helps you understand whether your claim is strong before investing months in the application process.
What Low-Approval States Mean for Your Strategy
If you live in a state with historically low SSDI approval rates, the data does not mean give up. It means adjust your strategy before you file — not after you are denied twice.
In low-approval states specifically:
Get legal representation before you file — not after your first denial. In high-caseload states where DDS reviewers are under time pressure, a well-organized initial application prepared with an attorney is significantly less likely to be denied for documentation deficiencies.
Request a consultative exam skeptically. DDS offices in high-caseload states sometimes schedule consultative exams with contracted physicians who see dozens of claimants per day. The evaluations are brief and the reports are frequently less favorable than those from your treating physician. Your attorney can advise on whether to accept or challenge a consultative exam report.
Expect reconsideration to fail — and prepare the ALJ file now. With national reconsideration approval rates at 16 percent and lower in several high-denial states, the realistic strategy is to treat reconsideration as a file-building stage rather than a genuine second chance at approval. Gather all updated medical records, request a new RFC from your physician, and contact an ALJ-experienced attorney before or during the reconsideration period.
For detailed guidance on the appeal process at every level, read our complete guide on SSDI Denied — How to Appeal.
How ALJ Variation Within States Creates Hidden Outcomes
The state-level data understates the actual variation in outcomes, because state averages conceal individual judge variation that is at least as significant.
Some judges approve 95 percent of cases while others deny nearly half. Your outcome depends on which judge hears your case, which field office processes your file, and which state you are in.
ALJ approval rates are publicly available through SSA’s annual reporting and through several attorney research tools that compile individual judge statistics. While claimants cannot choose their judge, this information is valuable in two ways:
An attorney who practices before a particular judge regularly knows that judge’s documentation preferences, vocational expert challenges, and how to frame RFC limitations most persuasively. Local knowledge matters.
If you are assigned a judge with a historically low approval rate — some deny cases at rates above 50 percent — this is information your attorney should factor into hearing preparation. A judge who requires very strong functional evidence should receive exactly that, presented in the most compelling way possible.
The approval rate for most hearing offices nationally was between 50 and 65 percent. Rates ranged from as low as 35 percent in Richmond, Virginia, to as high as 79 percent in Ponce, Puerto Rico.
A Note on What These Numbers Cannot Tell You
The state and national approval rates in this article are aggregate figures. They describe populations — not individual cases.
A claimant in Hawaii with ALS qualifies under the Compassionate Allowances program regardless of Hawaii’s historically low approval rate. A claimant in New Hampshire with poorly documented symptoms and no RFC assessment is not protected by New Hampshire’s high initial approval rate.
The data is most useful for setting realistic expectations and calibrating strategy — not for predicting individual outcomes. Two things that individual statistics cannot capture: the quality of your specific medical documentation, and the difference a well-prepared attorney makes in how that documentation is presented to the decision-maker.
Both of those factors are within your control in ways that your state’s approval rate is not.
For guidance on exactly what documentation strengthens an SSDI claim — and what RFC assessments should say — read our guide on How to Apply for SSDI in 2026.
Teresa — What She Did After Learning the Data
Teresa found a disability attorney after her second denial. Her attorney explained that Hawaii’s ALJ approval rate — 22 percent — was the lowest in the country at the hearing level, and that her judge had a personal approval rate below 30 percent.
That information did not discourage her attorney. It focused preparation.
The attorney ordered an updated RFC assessment specifically addressing Teresa’s functional limitations in terms the Grid Rules framework recognized. He researched the judge’s documented tendencies in prior approved cases and structured Teresa’s testimony around functional limitations the judge had weighted heavily in previous approvals.
Teresa was approved at her ALJ hearing.
Her state’s 22 percent approval rate was real. It was not destiny.
Research and editorial methodology: Data in this article is drawn from the SSA Annual Statistical Report on the Social Security Disability Insurance Program, 2024 — specifically Section 4, Outcomes of Applications for Disability Benefits, published at ssa.gov/policy/docs/statcomps/di_asr/2024/sect04.html. State-level allowance rate data draws from SSA Disability Determination Services workload reporting and hearing-level data from SSA Office of Hearing Operations annual reports. Individual judge variation data references Atticus research drawing from SSA public data sets, 2022 hearing office data. The GuideForBenefits.com editorial team reviews all statistical claims against SSA source documents before publication. This article was last updated May 2026.
This article provides general educational information only. It does not constitute legal advice. Individual claim outcomes depend on the specific facts, medical documentation, and circumstances of each case. Consult a licensed disability attorney for advice specific to your situation.
Frequently Asked Questions
Does my state's SSDI approval rate affect how much I get paid if approved?
No. Your monthly SSDI benefit amount is calculated under 20 CFR §404.1571 based entirely on your lifetime earnings record and the Primary Insurance Amount formula — not your state of residence. Average benefit amounts do vary by location but that is only because of differences in income and work history, not because of different payment rules by state. A claimant in Hawaii and a claimant in New Hampshire with identical earnings histories receive identical benefit amounts.
Can I move to a higher-approval state to improve my chances?
Technically yes — SSA processes your claim through the DDS office in your state of residence at the time of filing. However, moving states solely for approval rate purposes is rarely practical and involves significant life disruption. A more effective use of that energy is securing legal representation and building stronger medical documentation — both of which have a larger and more certain impact on outcomes than state selection.
Do ALJ hearing approval rates change year to year?
Yes. Individual ALJ approval rates and hearing office rates shift based on changes in staffing, case mix, circuit court precedent updates, and SSA policy guidance. SSA approval data is updated periodically. Rates change each year based on staffing, caseloads, and policy updates. The patterns described in this article reflect multi-year trends that are relatively stable — but specific percentages should be verified against the most current SSA data available at the time of your hearing.
Why is reconsideration approval so low — only 16 percent nationally?
Reconsideration involves the same DDS office reviewing the same file a second time, typically with the same general staff and the same documentation. Without new medical evidence, there is limited reason for the outcome to change. The structural design of reconsideration has been criticized by disability advocates for decades as a near-automatic second denial rather than a genuine independent review. The SSA implemented a prototype process between 1999 and 2020 in some states that eliminated reconsideration entirely and moved directly to ALJ hearings — approval rates in prototype states were higher. The current reconsideration stage persists in most states despite its low approval rate.
If ALJ approval rates are 51 percent nationally, why do most people not go to a hearing?
Many claimants give up after the initial denial or reconsideration — either because they do not understand the appeals process, cannot afford the wait time financially, or are not aware that the hearing stage has dramatically better odds. The cumulative effect means that many ultimately successful applicants experience multiple denials before receiving approval. This reality underscores the importance of understanding each stage's unique characteristics and preparing accordingly. The people who reach the hearing stage and win are not people with stronger cases than those who stopped earlier — they are often people with the same cases who simply continued.